Logs and telemetry
The Sema4.ai native app runs entirely inside your Snowflake account, and writes its logs, metrics, and traces to your account's event table. A limited subset is shared with Sema4.ai so support can help you when something goes wrong. This page covers how to read your own telemetry, and exactly what leaves your account.
Finding your event table
The app writes to the active event table in your account. To find out which table that is:
SHOW PARAMETERS LIKE 'event_table' IN ACCOUNT;Read the value column. A fully qualified name such as MY_DB.MY_SCHEMA.MY_EVENTS is your active event table. If the value is empty, your account is using Snowflake's built-in default, SNOWFLAKE.TELEMETRY.EVENTS, and telemetry is still being collected there.
The event table must be set at the account level. Snowflake does not collect telemetry from containerized applications when the event table is scoped to a database, so a database-level event table leaves you with no app logs at all.
To route app telemetry to a table of your own:
ALTER ACCOUNT SET EVENT_TABLE = <database>.<schema>.<event_table>;Reading recent logs
Substitute your event table and application name:
SELECT TIMESTAMP,
       RECORD:severity_text::string AS severity,
       VALUE                        AS message,
       RECORD_ATTRIBUTES
FROM SNOWFLAKE.TELEMETRY.EVENTS
WHERE RECORD_TYPE = 'LOG'
  AND RESOURCE_ATTRIBUTES:"snow.application.name"::string = '<app_name>'
  AND TIMESTAMP > DATEADD(hour, -1, CURRENT_TIMESTAMP())
ORDER BY TIMESTAMP DESC;
Severities follow the OpenTelemetry names: DEBUG, INFO, WARN, ERROR, and FATAL. To narrow the results to problems only, add:
AND RECORD:severity_text::string IN ('WARN', 'ERROR', 'FATAL')Contextual detail — request identifiers, agent identifiers, and similar — is available in the RECORD_ATTRIBUTES column rather than in the message text.
Reading logs from a running service
To see what a service is logging right now, without querying the event table:
SELECT SYSTEM$GET_SERVICE_LOGS('<app_name>.services.sema4ai', 0, 'sema4ai', 100);For the retained history of a service:
SELECT * FROM TABLE(<app_name>.services.sema4ai!SPCS_GET_LOGS())
ORDER BY TIMESTAMP DESC
LIMIT 100;
The app runs two services:
| Service | Contents |
|---|---|
services.sema4ai | The Sema4.ai platform: agents, the web interface, and the API |
services.postgres | The app's internal database |
Most application messages come from services.sema4ai. Those rows carry a service attribute of either agent-server or workroom, distinguishing the agent runtime from the web interface.
Find the app's logs in Snowsight
The app's services run in containers in your account, and their logs are available in Snowsight.
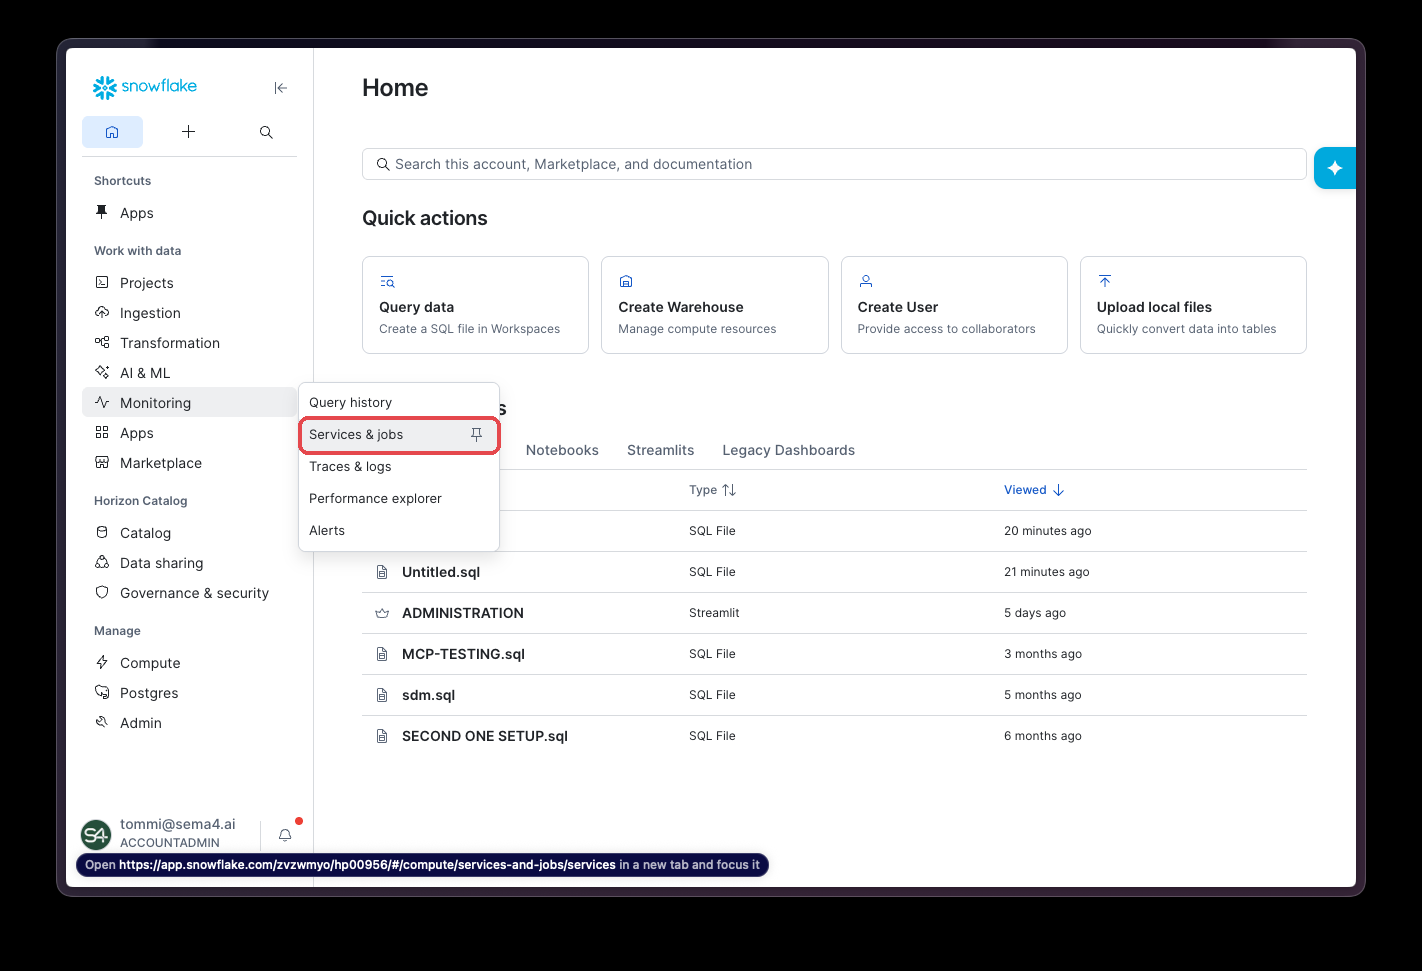
In Snowsight, go to Monitoring → Services & jobs:
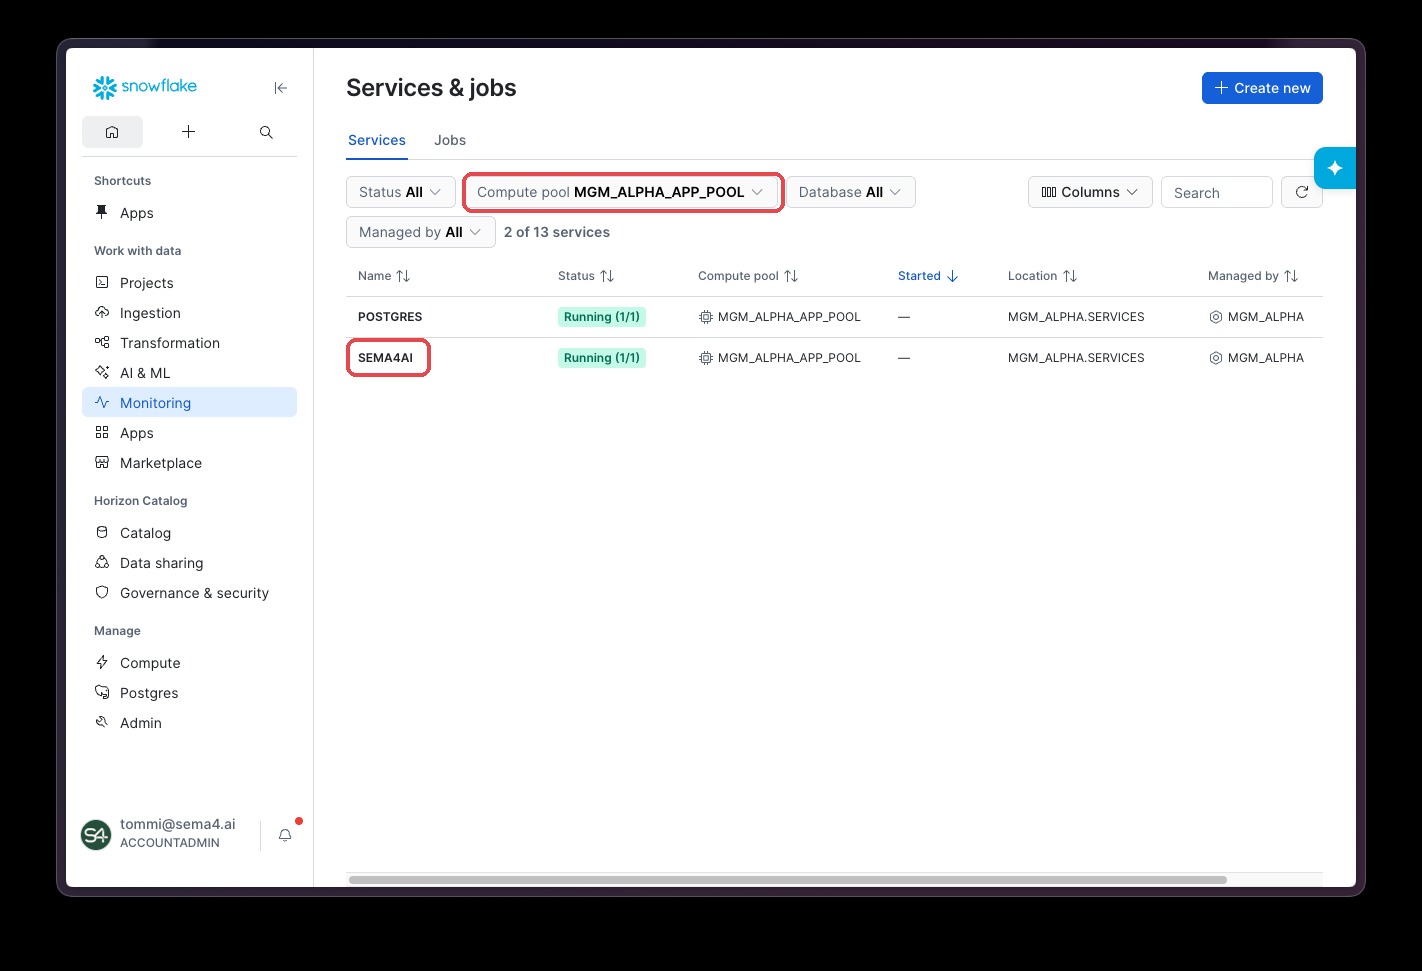
Filter Compute pool to the pool of the app instance you want to observe — the pool is named after the instance (for example, MGM_ALPHA_APP_POOL for an instance named MGM_ALPHA). Then open the SEMA4AI service:
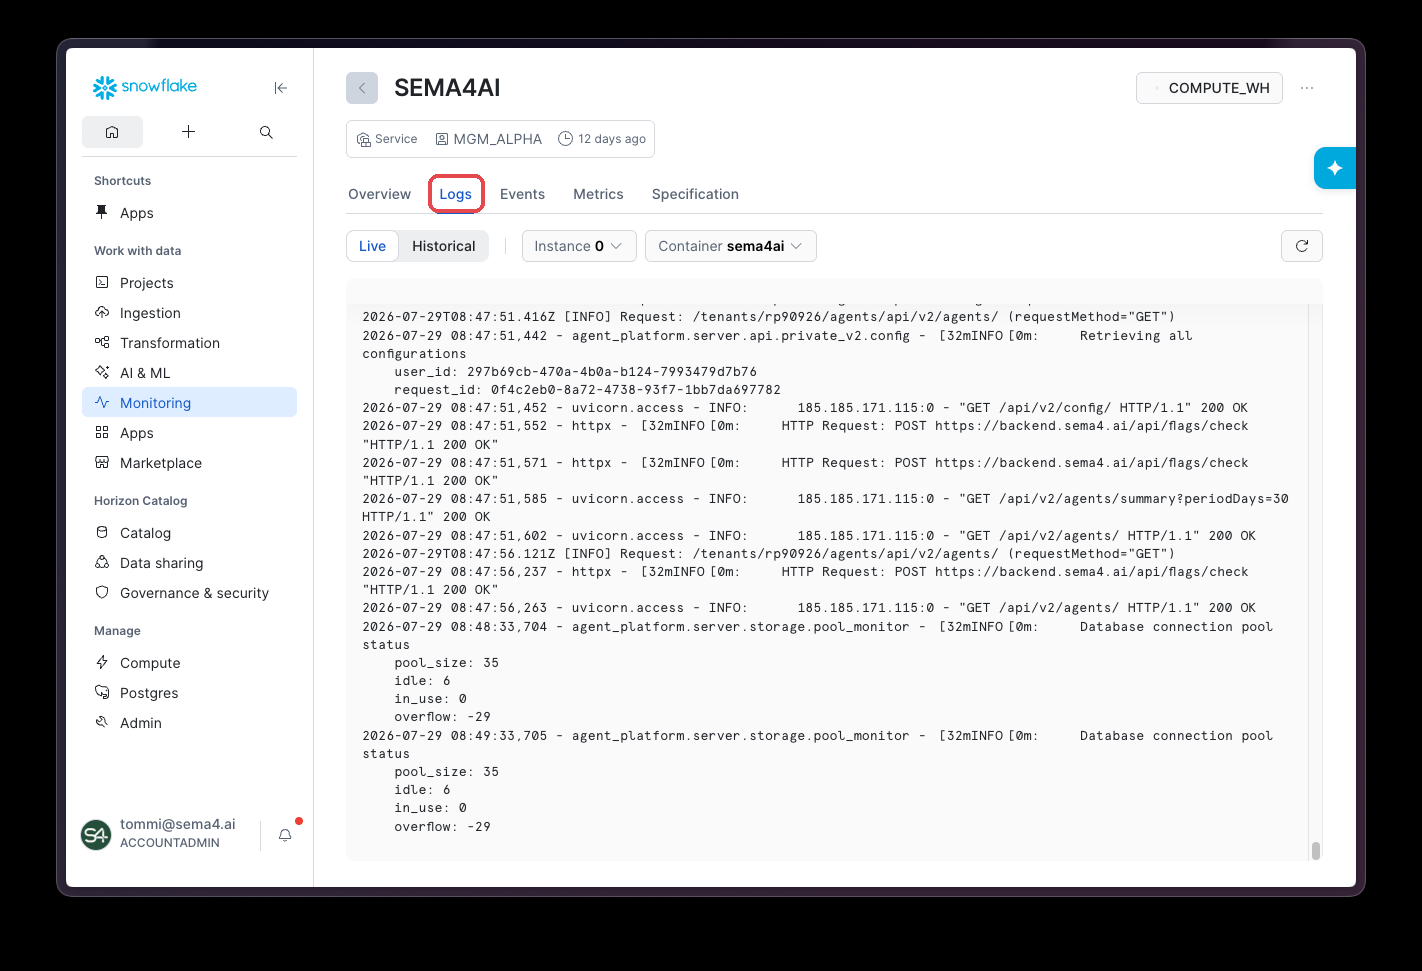
Under the service, open the Logs tab. You can follow live logs or browse historical ones, per instance and container:
Resource metrics
CPU and memory metrics for the app's services are collected alongside the logs:
SELECT TIMESTAMP, RECORD_ATTRIBUTES, VALUE
FROM SNOWFLAKE.TELEMETRY.EVENTS
WHERE RECORD_TYPE = 'METRIC'
  AND RESOURCE_ATTRIBUTES:"snow.application.name"::string = '<app_name>'
ORDER BY TIMESTAMP DESC;
What is shared with Sema4.ai
| Shared | Contents | Can you turn it off? |
|---|---|---|
| Always | Errors and warnings raised by the app | No |
| Always | Snowflake's CPU and memory metrics for the app's services | No |
| Optional | Informational activity logs | Yes — off unless you enable it |
| Optional | Detailed traces of agent runs | Yes — off unless you enable it |
To review or change what is shared, in Snowsight navigate to Data Products → Apps, select the app, choose Settings, then the App events tab. Items that are always shared are listed there for transparency; optional items can be switched on and off at any time.
Nothing is shared unless event sharing is authorized for the app in your account.
Sharing detailed agent telemetry with support
If Sema4.ai support asks for detailed telemetry about agent runs, two settings are involved, and both are yours to control.
Record agent traces in the app
Open the app and navigate to Configuration → Observability. Under the Sema4.ai-managed panel, enable Include agent traces. The app then records traces of agent runs into your event table.
Support mode additionally records infrastructure detail such as HTTP and database activity. Enable it only when support asks, since it produces considerably more data.
Share the traces from Snowsight
In Snowsight, navigate to Data Products → Apps, select the app, choose Settings, then App events, and enable sharing for traces.
Until this second step is done, agent traces stay in your account and are not shared with Sema4.ai.
Turn both settings off again once the investigation is finished. Detailed traces describe what your agents did, which is why they are off by default and never shared without your action.
Storage and cost
Telemetry is stored in your own event table and counts towards your Snowflake storage. The app logs at informational level to keep the volume reasonable. Verbose debug-level logging is not collected.
Getting help
When raising an issue with Sema4.ai support, the most useful details are your application name, the approximate time the problem occurred, and any ERROR rows from the query above.
Support can see errors and warnings shared from your install, but not informational logs or agent traces unless you have enabled sharing for them.