Monitor status of deployed agents
Control Room provides options to monitor the status of your deployed agents, as well as update, debug, and finally retire them.
This section covers:
- Overview deployed agents and view their details
- Publish updated agents from Studio to Control Room
- Deploy updated agents to Work Room
- Get insight into your agent troubleshooting options
- Retire no longer needed agents
Overview deployed agents
To list all deployed agents, select Deployed Agents in the left-side navigation menu in Control Room.
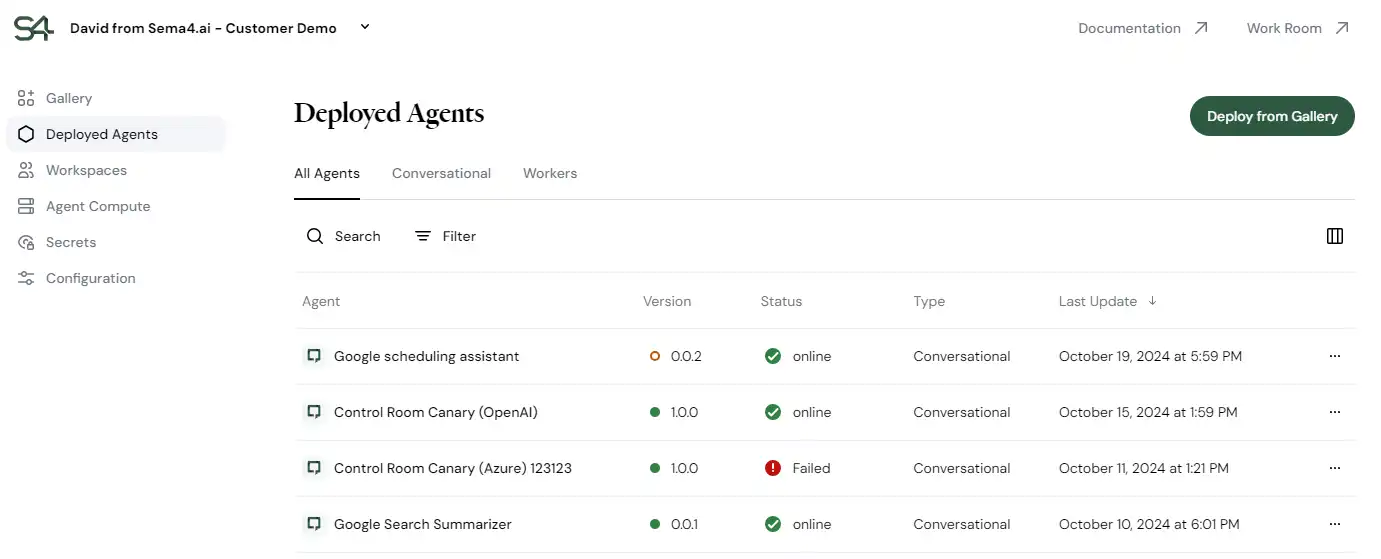
In the list, you can see important agent details by glance:
- Name: The name of the agent.
- Version: Latest version available in Control Room.
- Green dot means it's also deployed to Work Room.
- Orange circle means there's an update pending for deployment.
- Status: Indicates whether the agent is operational. Anything other than green checkmark requires your attention.
- Type: Indicates whether business users work with the agent directly (conversational) or the agent works based on workload assigned by automation (worker).
- Last update: The date when the latest version was published to Control Room.
The buttons on the far right provide additional options to edit and delete agents.
The edit button is useful when you wish to deploy an already deployed agent to another workspace.
Inspect agent details
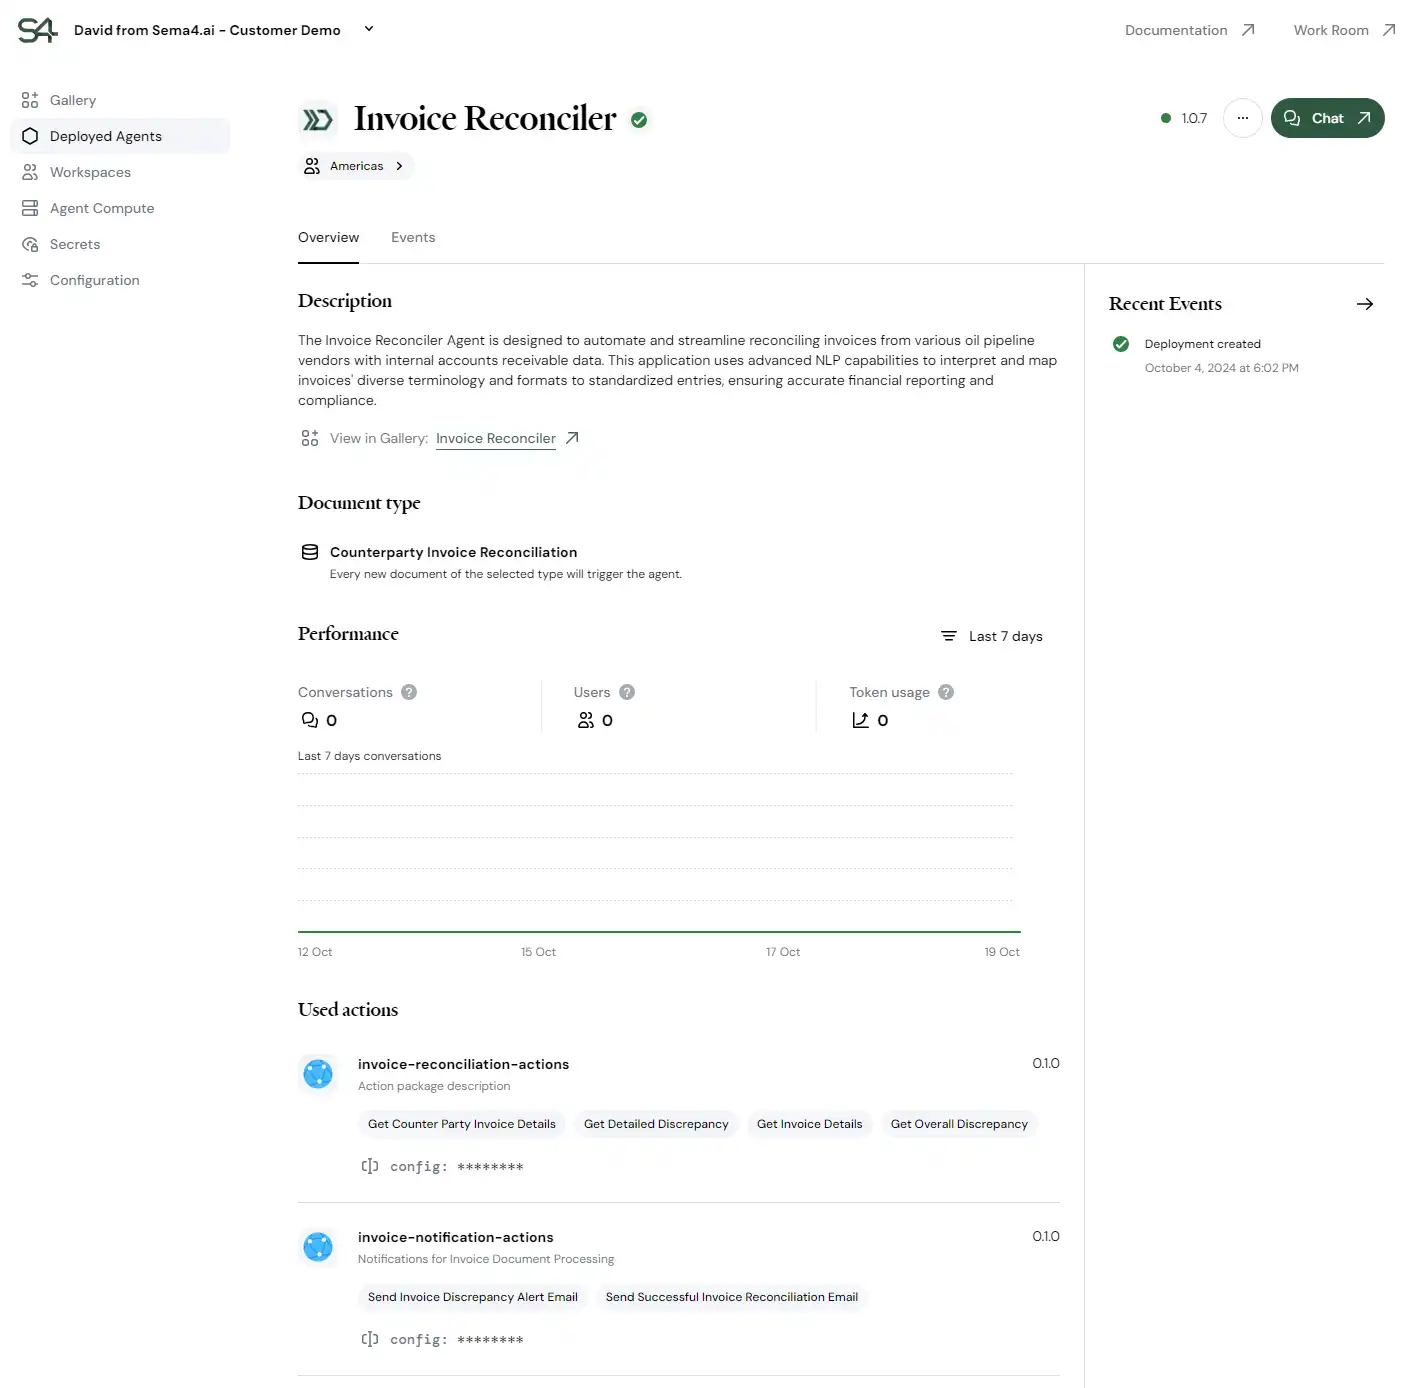
To view a deployed agent details, click an agent row in the overview.
There are different reasons you may want view agent details based on the status of the agent.
In general, the agent details screen provides:
- Name and description of the agent
- The workspace where the agent is deployed
- Overview of events, such as deployments or updates
- Usage metrics
- Actions the agent uses
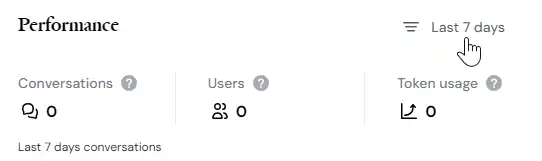
View usage metrics for operational agents
Under the Performance section, you can see the workload the agent has processed and how many unique business users interact with the (typically conversational) agent.
The displayed metrics depend on the type of agent:
- For conversational agents, the chart plots the total number of chat threads with the agent.
- For worker agents, the chart shows total number of work items (i.e., documents) processed by the agent.
You can adjust the timeframe for both the metrics and the chart using the Last 7 days button.