Observability and debugging
Because Sema4.ai agents operate directly within your VPC, the Control Room receives only minimal telemetry by default and never accesses confidential customer data without consent. The platform’s observability framework is built on OpenTelemetry instrumentation, which covers all key aspects of agent, application, and infrastructure performance.
Read more about agent build-time observability in Sema4.ai Studio.
Workspace-level Agent Observability
Agent and LLM observability is configured on the workspace level for deployed agents. This allows operators to choose which workspaces emit traces to Grafana or LangSmith, and which ones are excluded. This way operators don't need to manage per-agent taps.
Workspace-level observability and Grafana are available from Agent Compute 1.6.2 onwards.
Observability instrumentation in our agents provides a concise agent-level picture: high-value attributes (agent + thread identity, architecture, user), execution counters (runs, messages, threads), and LLM spans that summarize prompts/completions and token usage.
You must have an Administrator role in the workspace to configure observability. Follow the steps below to configure workspace-level observability.
Navigate to the correct Work Room
Open your Sema4.ai Work Room, and choose the correct workspace from the dropdown menu at the top left corner.
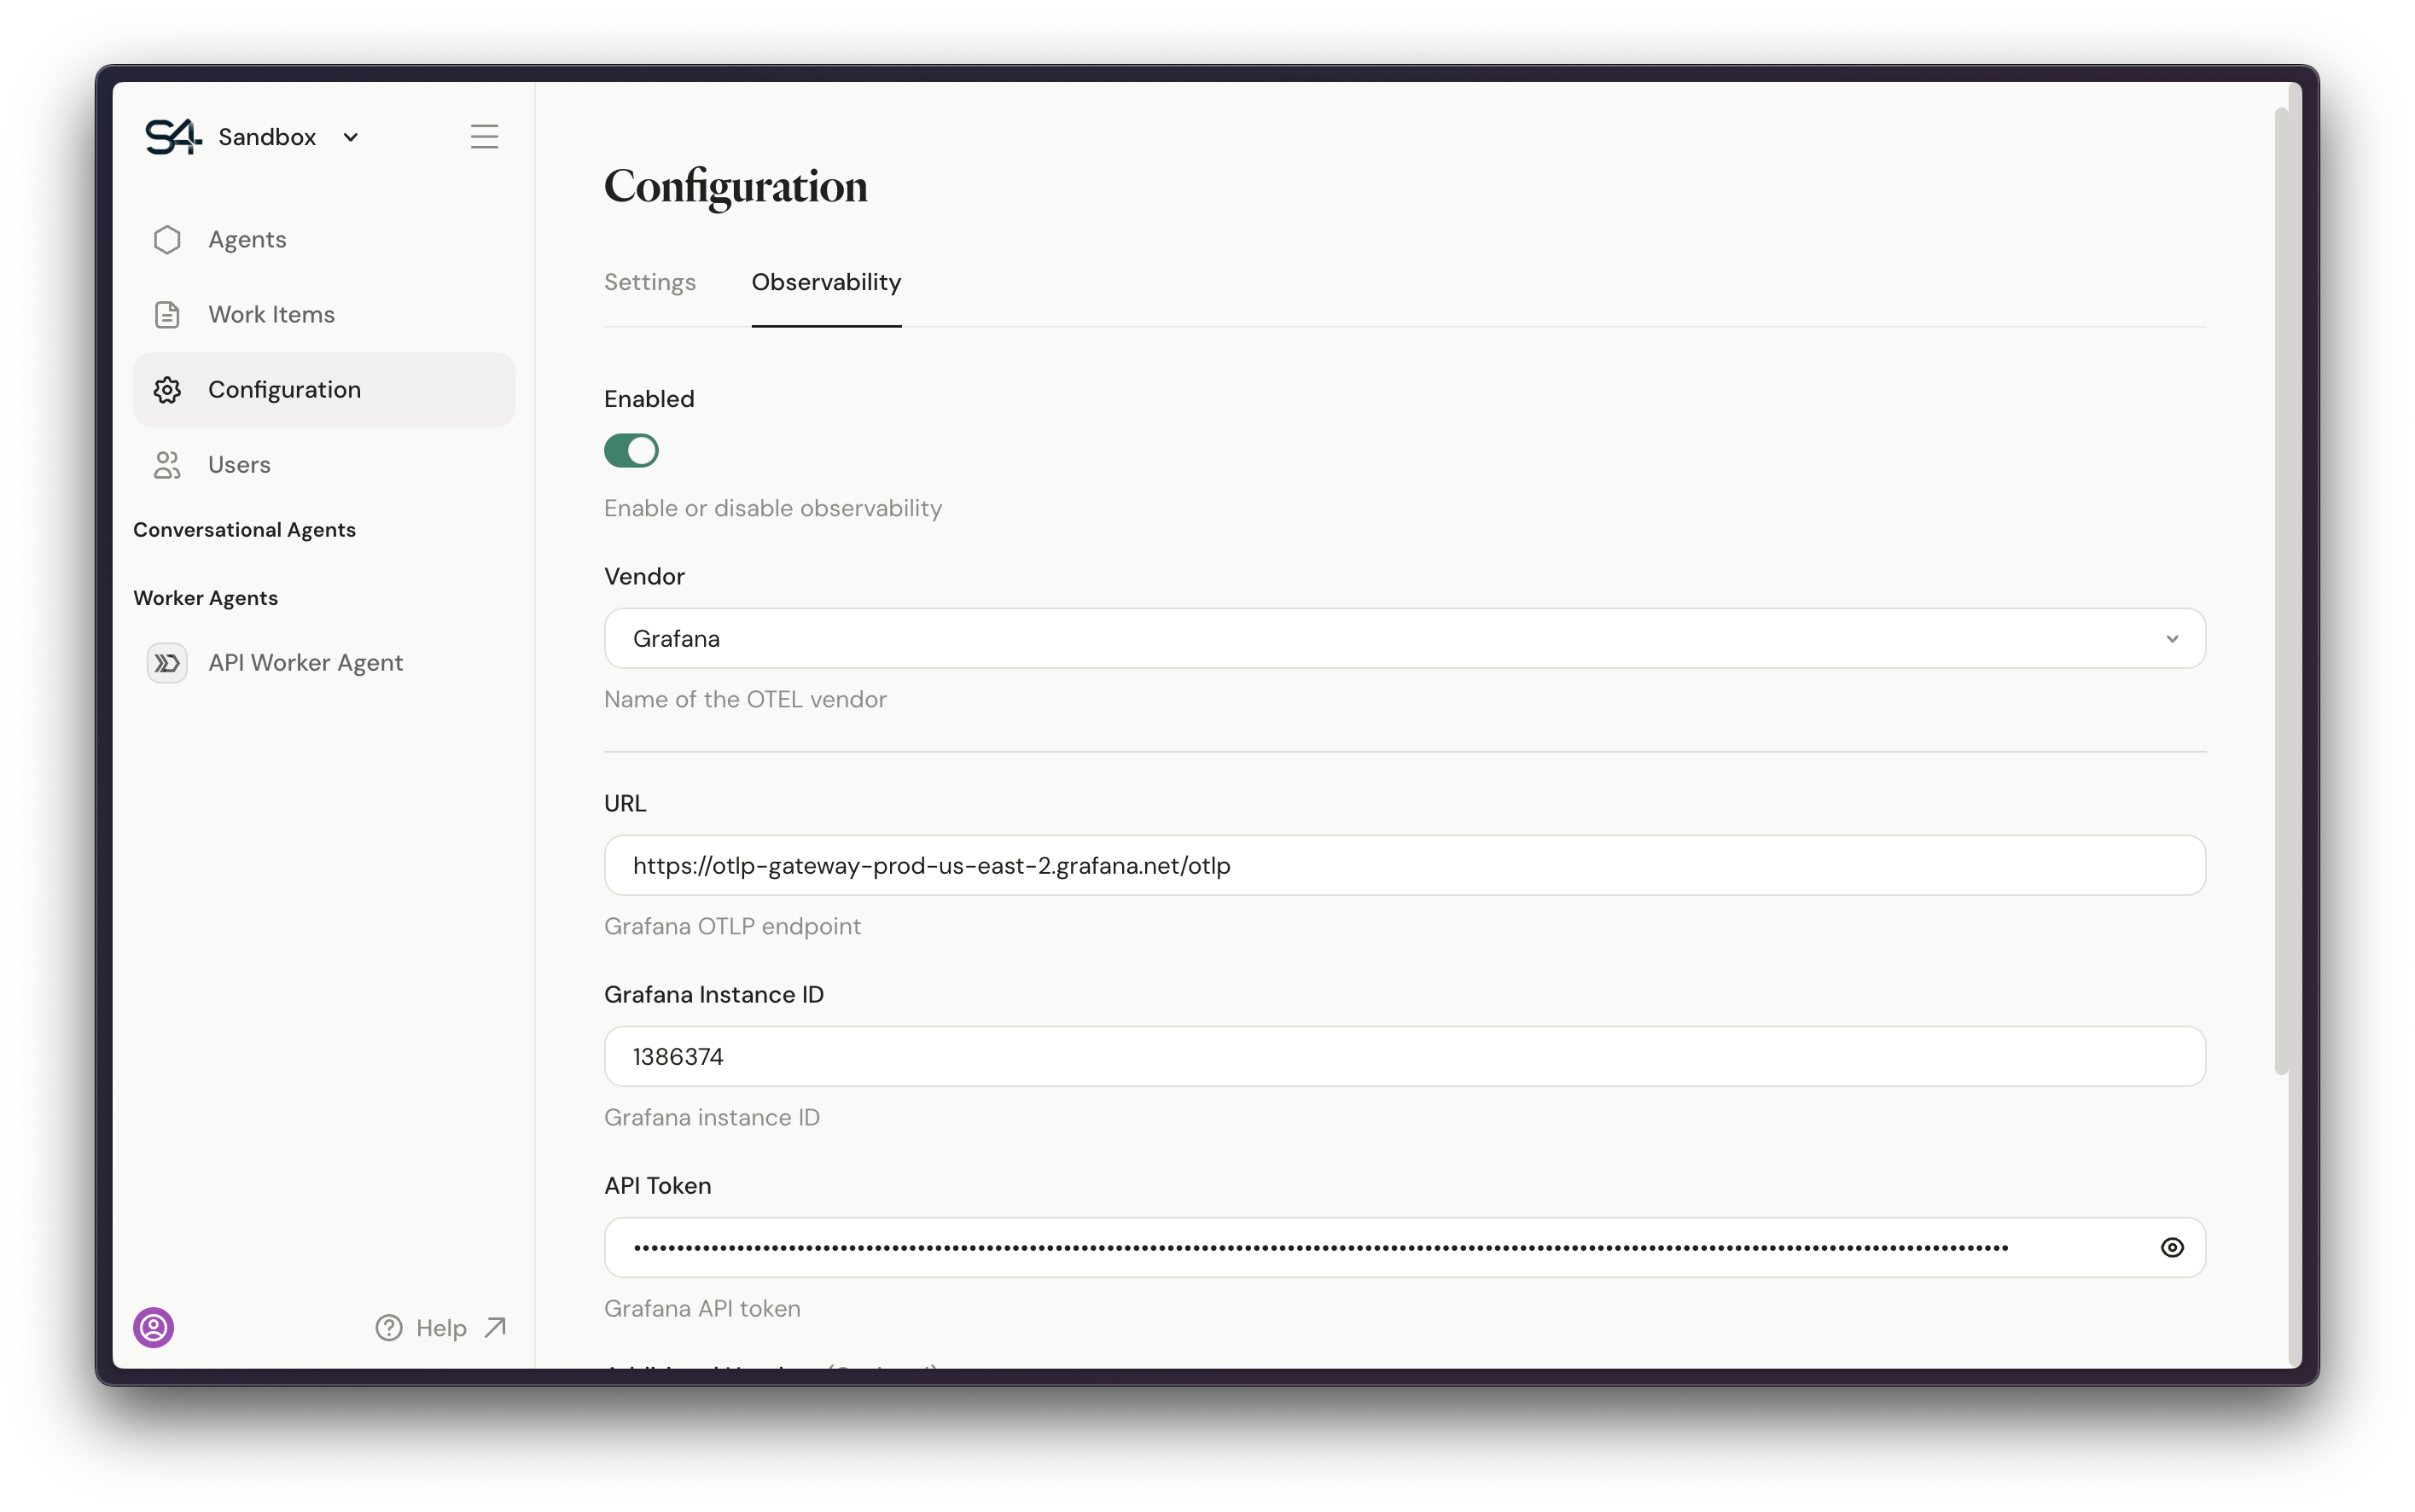
Then click Configuration from the left navigation menu, and select Observability tab.
Create a new observability configuration
- Switch on the Enabled toggle first.
- Choose the Grafana or LangSmith from the Vendor dropdown menu.
- Enter the details for the selected vendor, such as URL, API key etc. Refer to the target platform's documentation for the exact details.
- Click Save to save the changes.
LangSmith hosted URLs are https://api.smith.langchain.com for US and https://eu.api.smith.langchain.com for EU. Hosted Grafana's OTLP endpoint in US is https://otlp-gateway-prod-us-east-2.grafana.net/otlp. Always validate the URL with your own setup before using it.
Once configuration is Saved, all agents in the workspace will start emitting traces to the selected platform. You may later edit the configuration and save again, or disable the observability for the workspace with the toggle. This will not clear your configuration details allowing you to re-enable observability later.
Agent-level Observability (Deprecated)
Agent-level observability is deprecated and will be removed in the next versions after Agent Compute 1.6.2. It is replaced by workspace-level observability as described above. Meanwhile, both agent-level and workspace-level observability are supported and can be used in parallel. We recommend to migrate to workspace-level observability as soon as possible.
Agent specific observability traces similiar things as the Workspace-level observability, but only supports LangSmith, and configuration is done in two steps in Control Room for each deployed agent separately. LangSmith account is required to be created and API key obtained from LangSmith.
Configure Integrations in Control Room
- Navigate to Configuration > Integrations in Control Room
- Click Integration and select LangSmith from the Type menu
- Enter the LangSmith URL, Project name and your API Key
- Click Create to save the changes
This creates a new integration configuration in Control Room, that can be then used with agents when they are deployed.
Configure observability in agent deployment
When deploying an agent, you can select the integration configuration you want to use for the agent. You may edit the integration selection later through agent deployment edit dialog.
Platform Observability
In addition to agent and LLM observability, the Sema4.ai platform itself emits traces to the selected observability platform. This allows operators to monitor the platform's health and performance with tools like Splunk, Datadog, Grafana, Dynatrace, etc
The instrumentation covers Agent Compute and tenancy metadata, deployment/runtime & Kubernetes health, request/network/log/error traces, storage/DB/secret activity, and control-plane, connector, and channel service metrics.
Platform observability is configured by the IT admin who has Administrator role, and ability to update Agent Compute infrastructure. Follow these steps to configure platform observability:
Navigate to the correct Agent Compute
Open your Sema4.ai Control Room, and go to Agent Compute view from the left navigation menu, and choose the correct Agent Compute from the list view.
Edit the Agent Compute configuration
Click the Settings button in the top right corner of the Agent Compute details page. Scroll down, and expand the Advanced Configuration section.
Create a new observability configuration
At the bottom of the Advanced Configuration section, you will see two options, one for Datadog specifically, and one for custom OTLP. Choose the one that suits your needs, and provide the necessary connection details.
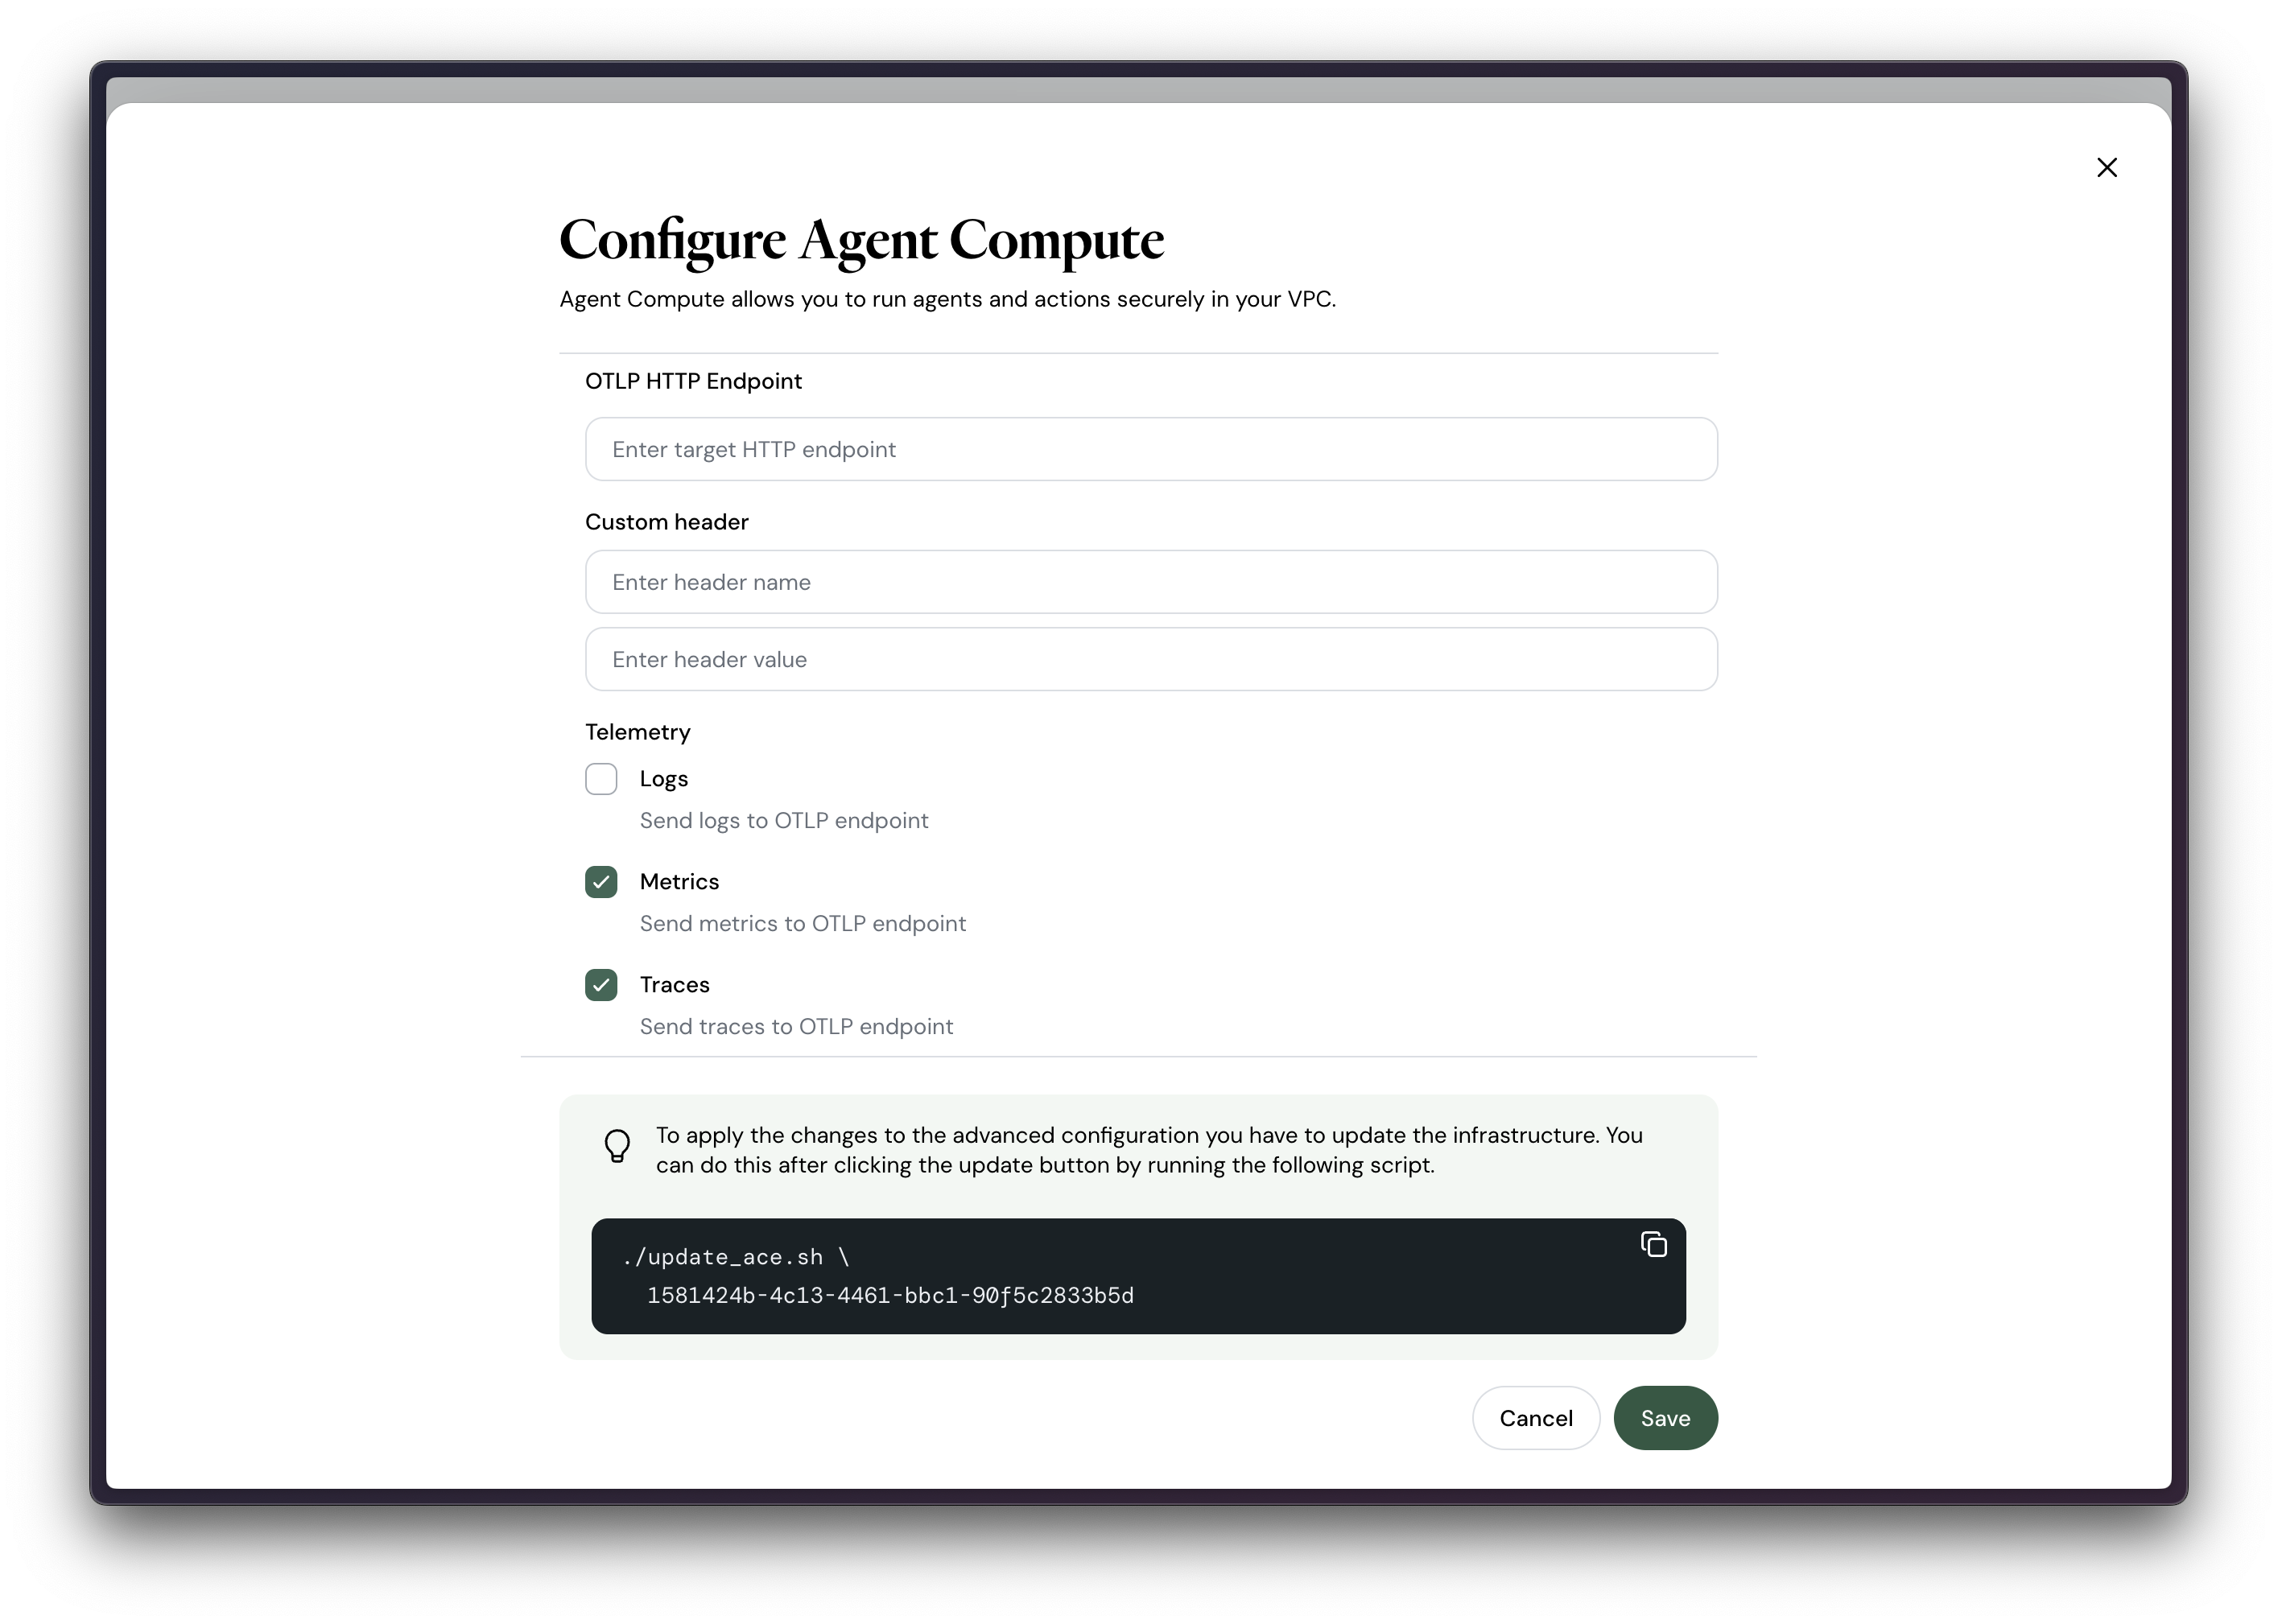
Update the Agent Compute infrastructure
Once you have provided the necessary connection details, you will be shown an Agent Compute infrastructure update terminal command. In order for the observability configuration to take effect, you need to update the Agent Compute infrastructure with the given command.
Agent Compute logs in AWS
This guide explains how to fetch system logs from your ACE deployment hosted on AWS using Kubernetes tools.
Prerequisites
Before you begin, ensure you have:
Tools:
- AWS CLI installed and configured
kubectl(Kubernetes command-line tool)k9s(optional, for interactive log browsing)
Access Requirements:
- Valid AWS user credentials
- Permissions to access the EKS cluster
- ACE identifier and AWS region for your deployment
Configure Kubernetes Access
Connect your local kubectl to the ACE cluster:
aws eks update-kubeconfig --region <REGION> --name <ACE_IDENTIFIER>Example:
aws eks update-kubeconfig --region us-east-1 --name ace-1581424b-4c13-4461-bbc1-90f5c2833b5dFind Your Namespace
List available namespaces to identify your workspace:
kubectl get namespacesLook for the namespace matching your workspace ID (format: ten-<WORKSPACE_ID>).
List Pods in Your Namespace
View all pods in your workspace namespace:
kubectl get pods --namespace <NAMESPACE>Example:
kubectl get pods --namespace ten-74fefabc-ffe5-472d-8fc2-93320add83f2Fetch Logs
View logs from a specific pod:
kubectl logs -f --namespace <NAMESPACE> <POD_NAME>Example (spar container logs):
kubectl logs -f --namespace ten-74fefabc-ffe5-472d-8fc2-93320add83f2 spar-78fdcbf584-ffjjgThe -f flag streams logs in real-time. Remove it to view existing logs only.
Alternative: Using k9s
For an interactive experience, launch k9s after completing Step 1. You can browse namespaces, pods, and logs using the interactive interface.
Reporting issues
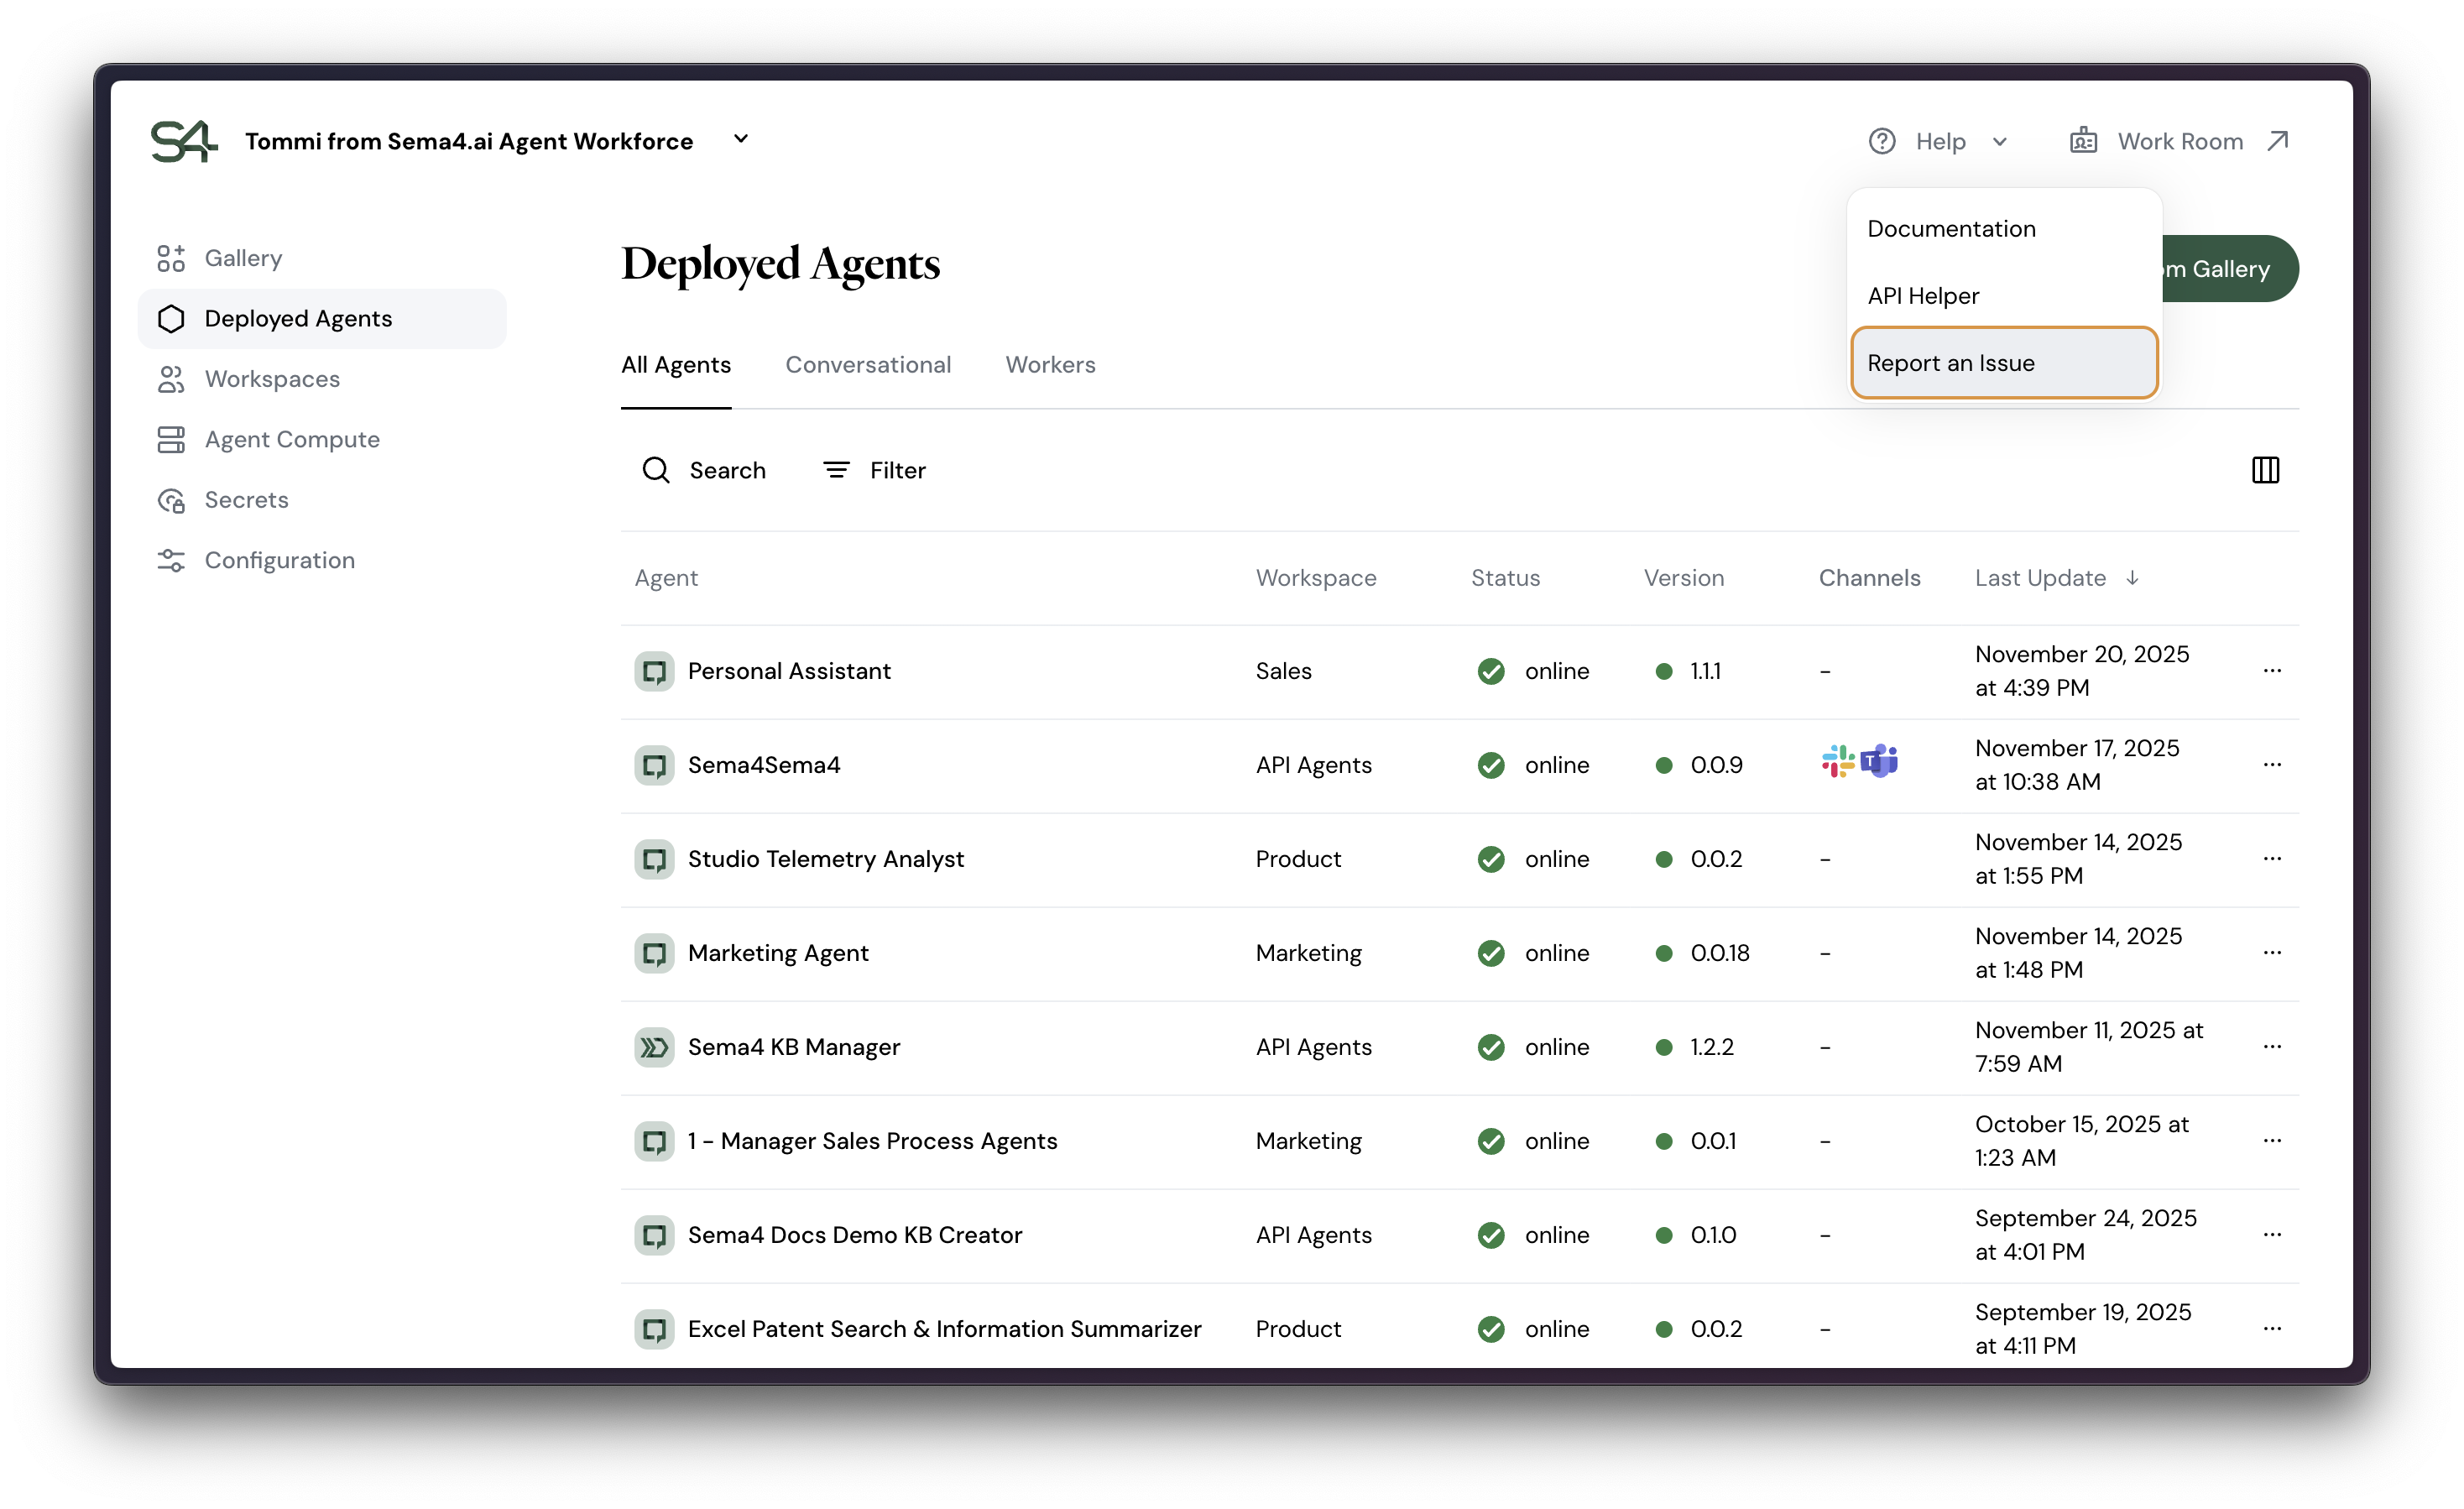
Control Room provides a way to report issues to Sema4.ai support team. You can report issues by clicking the Help button at the top right corner of the Control Room interface, and choosing Report an Issue.
This will open a dialog that allows you to describe your issue and choose what type of issue it is, and in which workspace it occurred. The issue will be logged and the Sema4.ai support team will be notified.
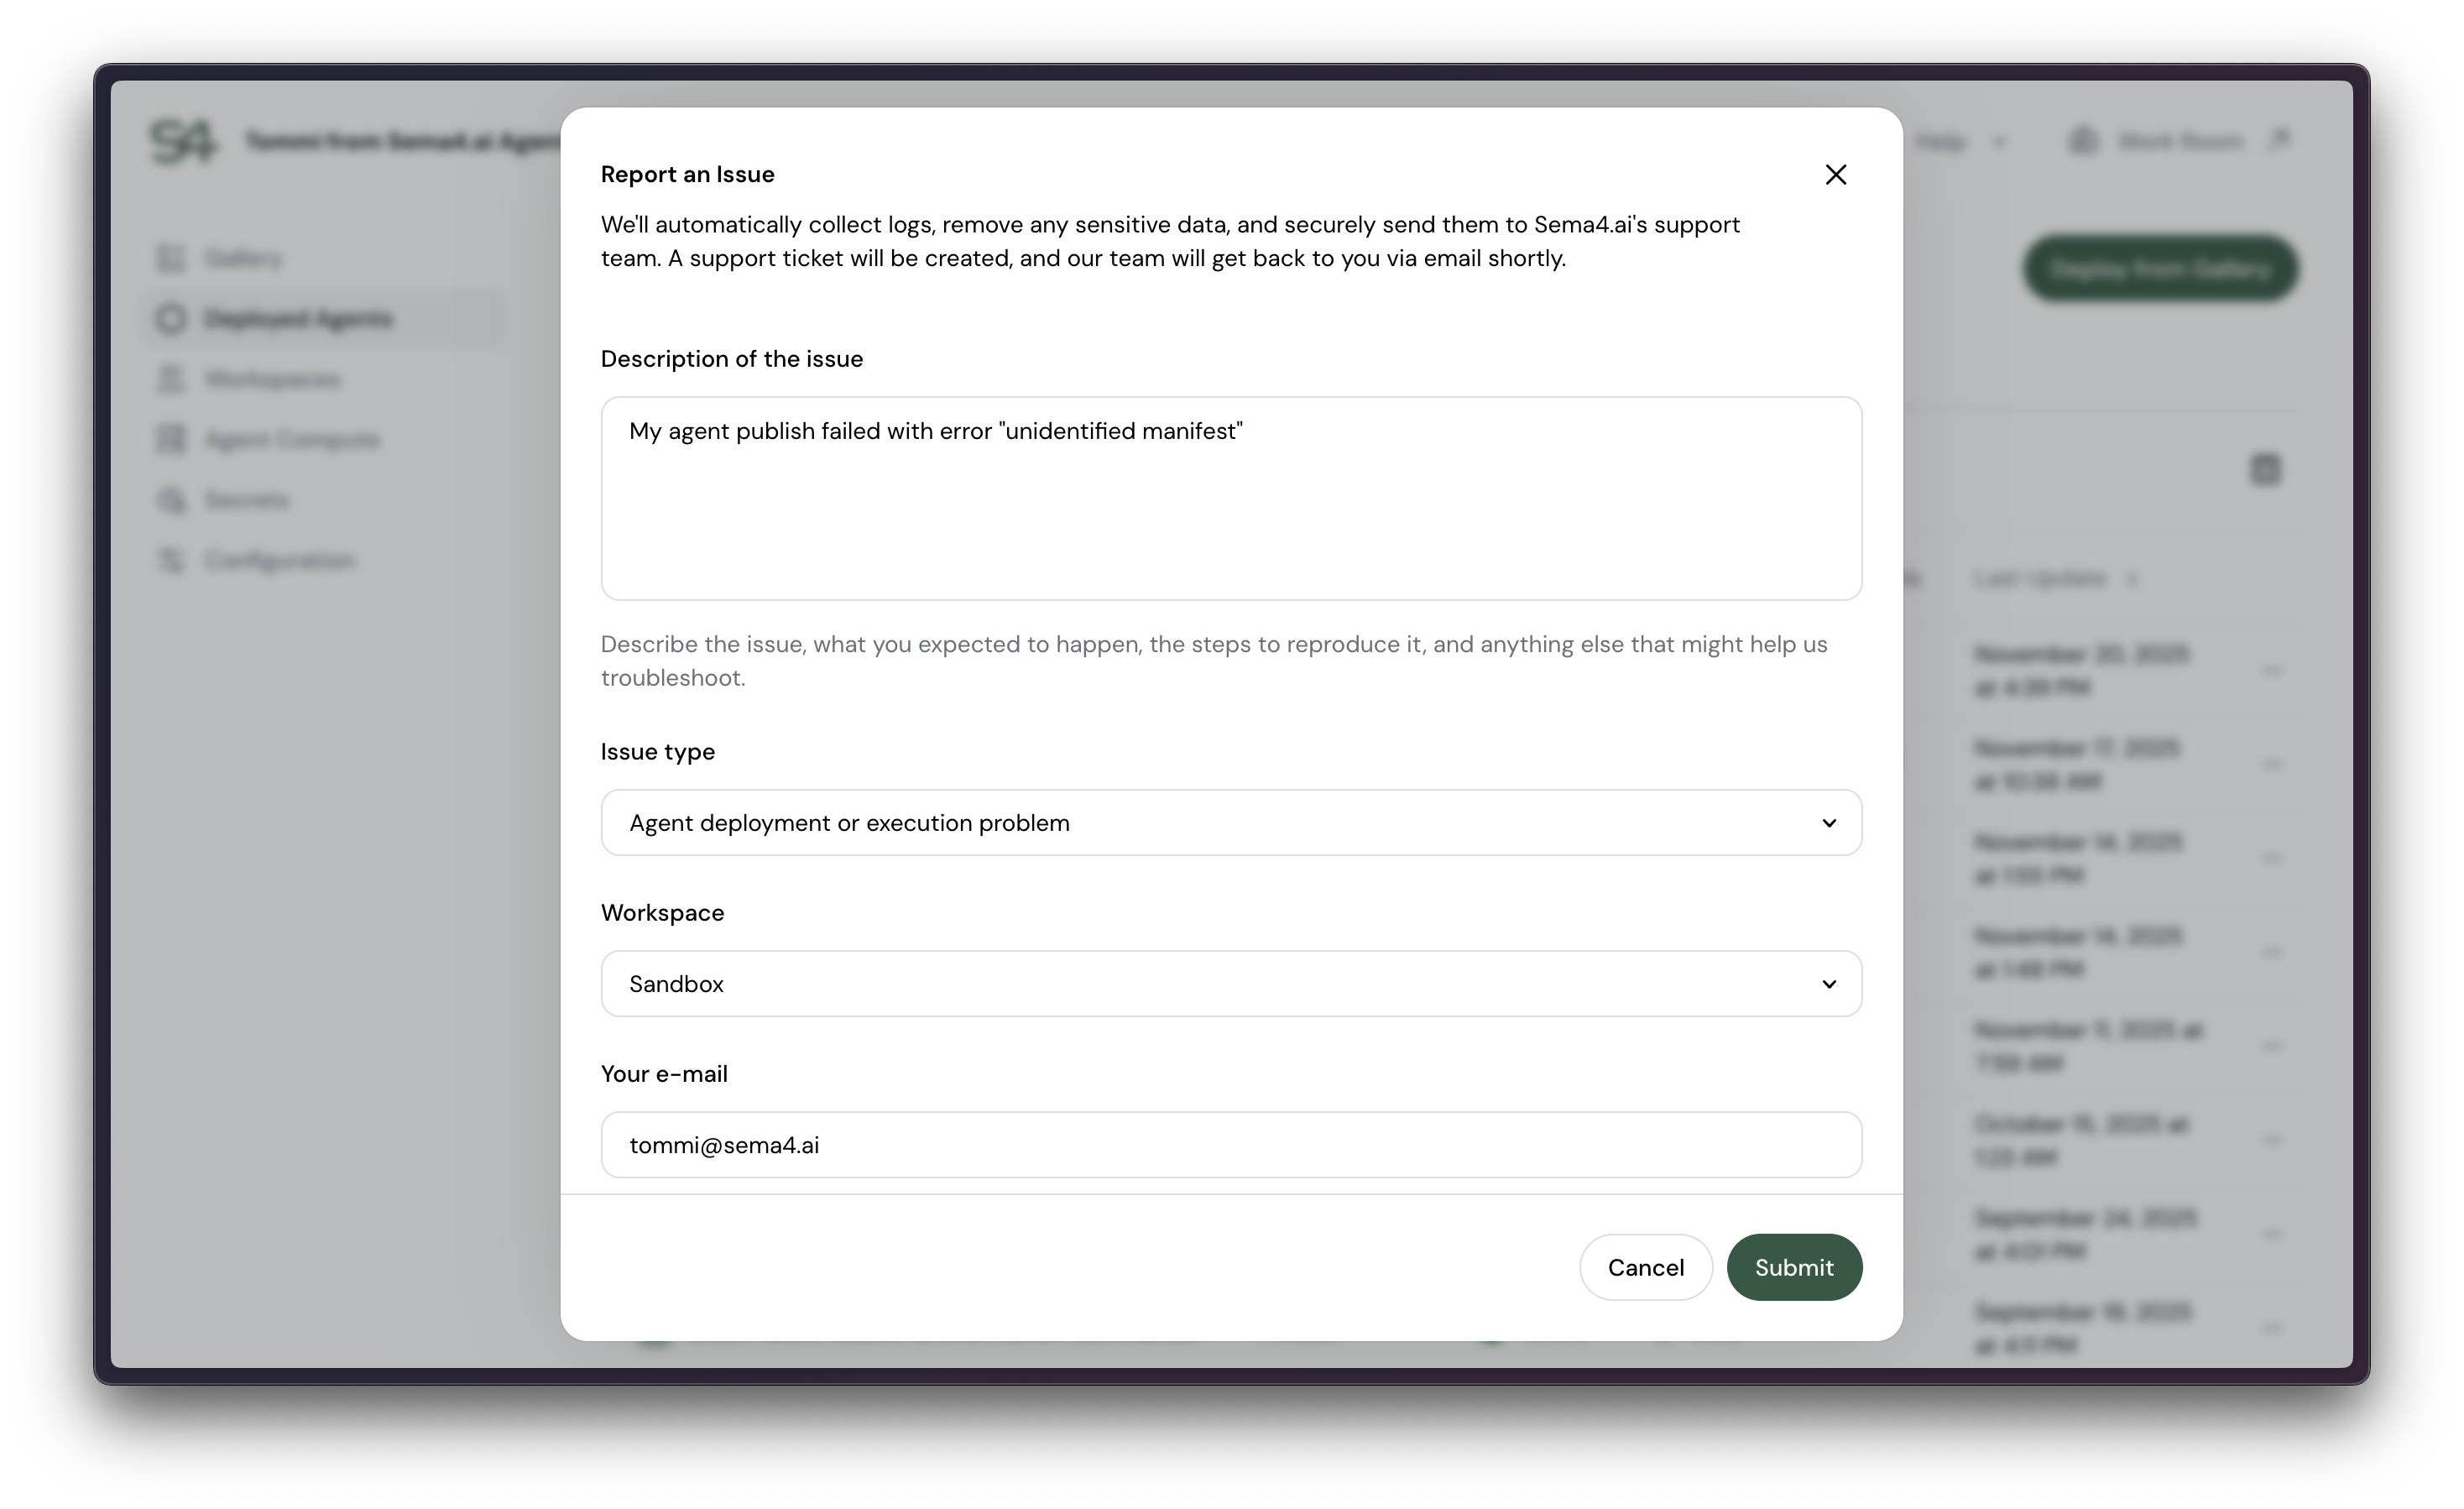
Once submitting, the platform automatically collects the recent logs from the relevant Agent Compute (for last ~15mins) and sends them to the Sema4.ai support team. We recommend to replicate the issue and then immediately submit the issue to get the most comprehensive logs.