Analytics
Analytics shows how your agents are being used and how they're performing — active users and agents, conversation and work-item volume, and activity over time.
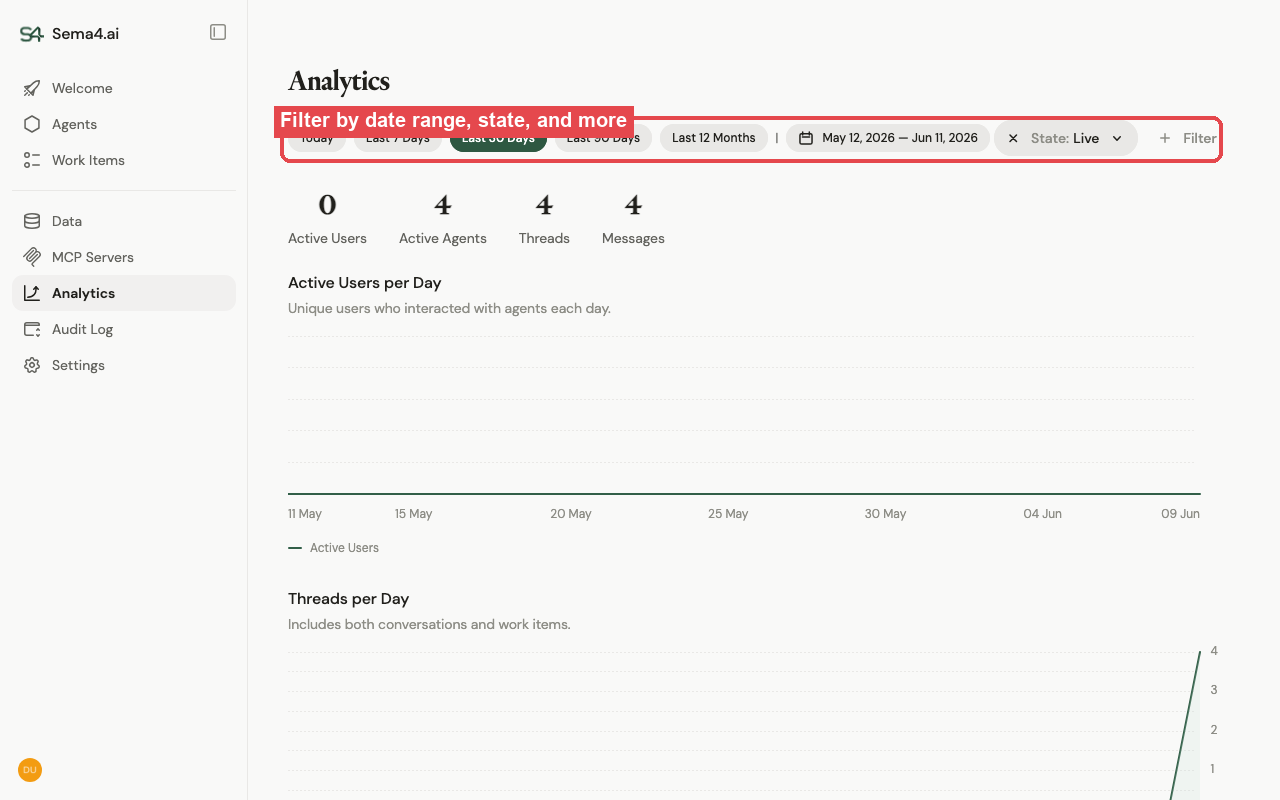
Filter the whole view with the controls at the top: pick a preset range (Today, last 7 / 30 / 90 days, last 12 months) or a custom date range, narrow by agent state (e.g. Live), and use Filter for more. Use it to track adoption, spot agents that need attention, and understand usage patterns across the workspace.